

An interesting paradox exists in the stock market: the vast majority of stocks in an index actually underperform the index in which they are a member.
This occurs because the pattern of returns in the stock market is positively skewed, meaning a relatively small number of very high performing stocks are typically responsible for most, or all, of the market’s return. Below is a chart from Standard and Poor’s showing the distribution of cumulative performance of the stocks in the S&P 500 over a 20-year period.1
Constituent Returns for S&P 500 Members Are Highly Skewed
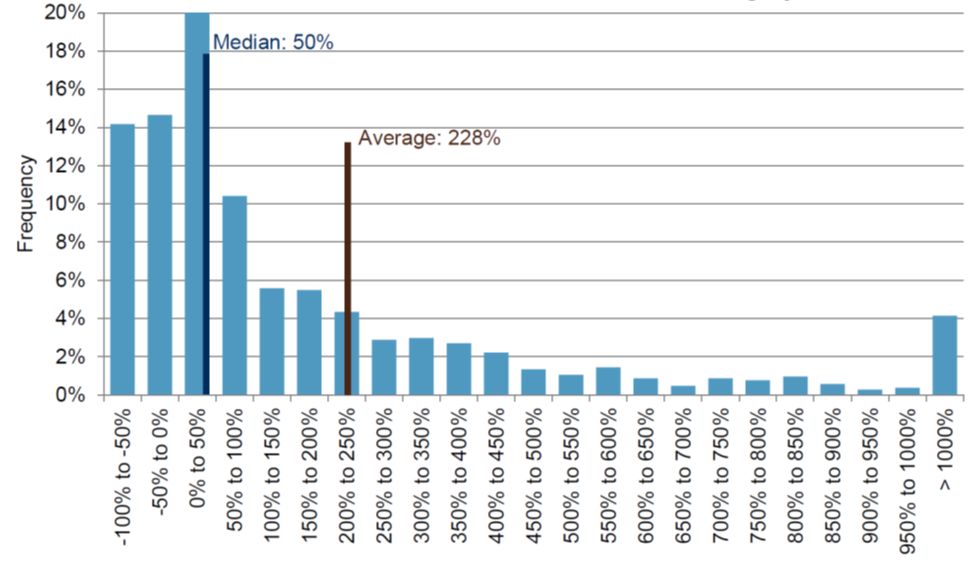
The above chart shows that from 1998 through 2017, the median stock returned about 50% cumulatively which is only a 2.0% annualized return! The average return of the 500 stocks over that time period was 228% cumulatively or 6.1% annualized. Thus, while every stock has a 50/50 chance of being above the median, each stock has much less than a 50/50 chance of being above average.
The positive skew of stock returns occurs because, while the most a stock can lose is 100%, the potential positive returns for a stock are well above 100%. It also occurs because mathematically, compounding of random returns, even if symmetrically distributed, creates a skewed distribution of returns over time.
The skewed pattern of distributions results in some surprising facts about what drives overall stock market returns. A study2 of the returns of the over 25,000 publicly-traded stocks that existed over the 90-year period between 1926 and 2016 found:
- The mean annual return of all stocks between 1926 and 2016 was 14.74%, while the median was a mere 5.23%. That is a HUGE difference.
- Over half the stocks delivered negative returns during their lifetimes.
- Only 42% outperformed the 3-month Treasury Bill.
- Just five stocks (Exxon, Apple, Microsoft, GE and IBM) account for 10% of all wealth created by the stock market between 1926 and 2016.
- Just 4% of all stocks accounted for all the wealth created by the stock market from 1926 and 2016.
A similar study3 of data from a shorter time period, 1989 through 2015, found like results: a very large positive skew where just 20% of the stocks produced all the return, over 50% of the stocks underperformed cash and 40% of the stocks provided a negative return. The longer time periods have greater skew due to the effects of compounding. In other words, return distributions will appear more symmetrical over shorter time periods, but will skew more positively over longer periods.
What This Means for Investment Portfolios
The positively skewed pattern of stock returns reveals the importance of diversification – “not only does diversification reduce the variance of portfolio returns, but non-diversified stock portfolios are subject to the risk that they will fail to include the relatively few stocks that, ex post, generate large cumulative returns.”4
The skewed distribution explains why it is so hard for active managers to keep up with the index. Active strategies are more concentrated than the index and thus are less likely than the index to contain the stocks that drive most of the investment performance. Unless an investment manager owns the relatively few stocks that provide most of the returns, the manager will underperform the index. The skewed distribution of returns “helps us understand the mystery of how so many smart people, with enormous financial and informational resources, systematically do such a poor job investing money.”5
By investing in the index, you are guaranteed to own those few high performing stocks. You won’t fall behind because you (or your investment managers) didn’t realize that Dominos (up over 4,000% over the past 10 years) or Ulta Beauty (up over 7,000%) were going to be huge performers! However, it also means that your returns will be dragged down by the majority of stocks in the index that are losers.
The flip side of the coin is the opportunity to outperform presented by the skewed pattern of returns. An investment manager who successfully identifies and owns those relatively few stocks that provide the vast majority of returns will handily outperform. Of course, finding an investment manager with the skill and discipline to select a portfolio containing primarily winners is extremely challenging. Additionally, even if winning stocks are identified, owning the winners in a concentrated manner can make for a very rough ride. For example, if you were to own the FANG stocks over the last 20 years, you would have had incredible overall success, but there would have been challenging periods of time along the way:
- Facebook experienced drawdowns of 50%+, 40%+, and two more of 20%+.
- Amazon experienced a drawdown of 90%+ in the tech bubble, and after recovering had five more 25%+ declines.
- Netflix has experienced three separate drawdowns of over 70%, another over 50%, and four more of 25%+.
- Google experienced a drawdown of 65% during the financial crisis and had two more of 20%+.
The effect of concentrated portfolios either being big winners or big losers by owning/not owning the relatively few high performing stocks can be seen via the return distribution of so-called “high active share” funds. Active share refers to the percentage of a portfolio that differs from a benchmark index; it is a way of expressing how active a fund or manager is. High active share means that a portfolio is very different from its index while low active share means that the fund is index-like. The chart below from Vanguard shows the dispersion of returns over a ten-year period based on the active share of 903 mutual funds. As you can see, the higher the active share, the greater the dispersion of returns.
Higher Active Share Led to Higher Dispersion of Excess Returns
(January 1, 2006 to December 31, 2011)
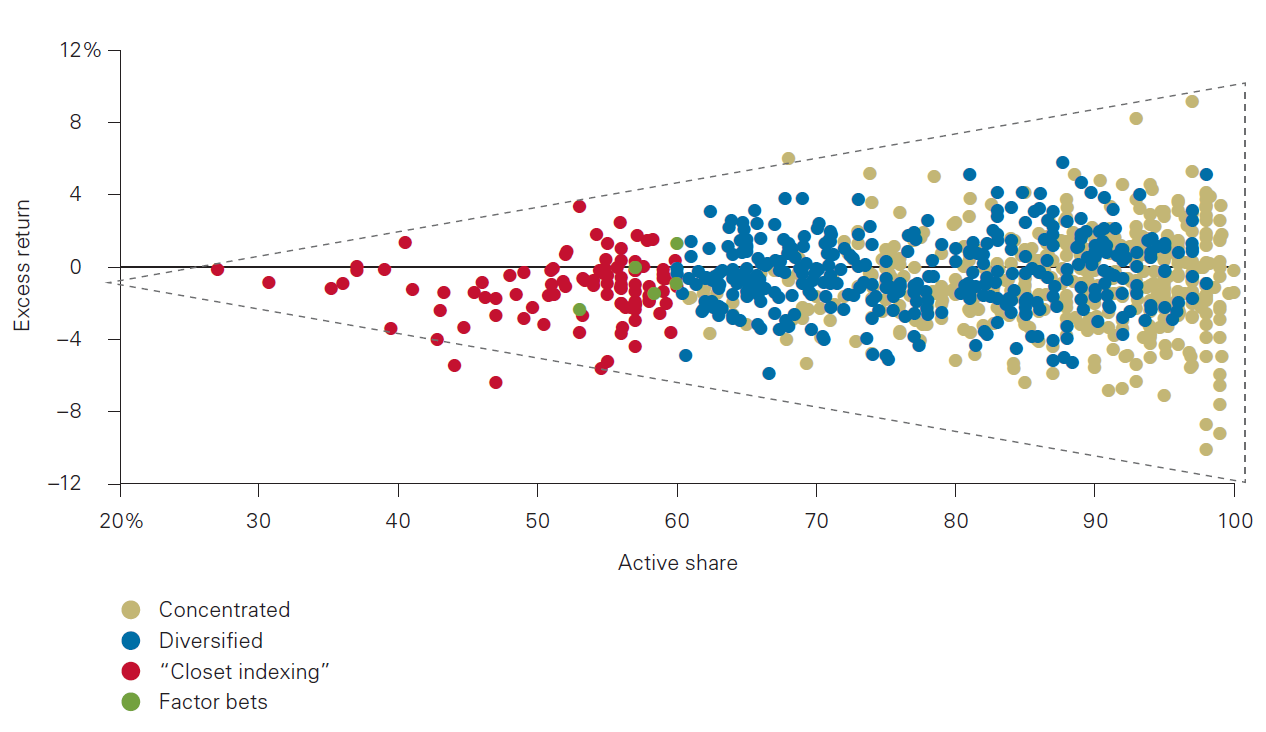
Source: Vanguard calculations, using data from Morningstar, Inc
Conclusion
The positively skewed distribution pattern of stock returns means that, over longer periods of time, portfolio diversification is extremely important. In contrast, owning a small basket of stocks will most likely result in underperformance unless great skill and/or luck results in the concentrated portfolio containing many of the relatively few stellar performers. Therefore, we believe most investors should have a very diversified portfolio (which may or may not be an index fund) as their core holding(s). Complementing this core holding with concentrated strategies is an option for those investors who would like to enjoy the best of both worlds. While the use of concentrated portfolios is risky, it can potentially be very rewarding and for most investors, works best when combined with a diversified core.
1S&P Whitepaper, The Slings and Arrows of Passive Fortune, available at https://us.spindices.com/documents/research/research-the-slings-and-arrows-of-passive-fortune.pdf
2Hendrik Bessembinder, Do stocks outperform Treasury bills?, Journal of Financial Economics, 2018, vol. 129, issue 3, 440-457
3Heaton, J.B. and Polson, Nick and Witte, Jan, Why Indexing Works (May 10, 2017). Applied Stochastic Models in Business and Industry 33 (6), 690-693..
4Bessembinder, Do stocks outperform Treasury bills?
5Heaton, et al., Why Indexing Works.
