

Years ago, our firm employed a junior investment analyst who left us for supposedly greener pastures. In his exit interview, he told me he was leaving in part because he was great at picking investment managers that outperformed the market and wanted more opportunities to practice this skill. As our conversation progressed, we ended up making a $100 bet in which each of us picked an actively managed mutual fund in three categories: domestic stocks, international stocks, and bonds. We would equal-weight their performance, and whoever had the highest value portfolio after three years would win.
The junior analyst spent days combing through the characteristics and statistics of funds to pick his three, which had all consistently outperformed in the past. I took a different tack: I randomly picked three funds on our investment consultant’s “watch list” due to poor performance. It took me about three minutes.
How’d we do? After three years, I was the winner. And it wasn’t even close. Instead of cashing my former colleague’s $100 check, I taped it to my wall to remind me of the importance of an often misunderstood concept that I employed to win the bet: regression to the mean.
Many people are aware of this concept but overlook it when making investment decisions. They select investments based on past performance, assuming there’s a reason these portfolios are performing well and that they will continue to perform well for that reason. However, luck and randomness are a significant aspect of the markets and investing, and regression to the mean happens all the time. Understanding what it is and how it applies to the markets is essential to maximizing your investments’ performance.
But First, Correlation
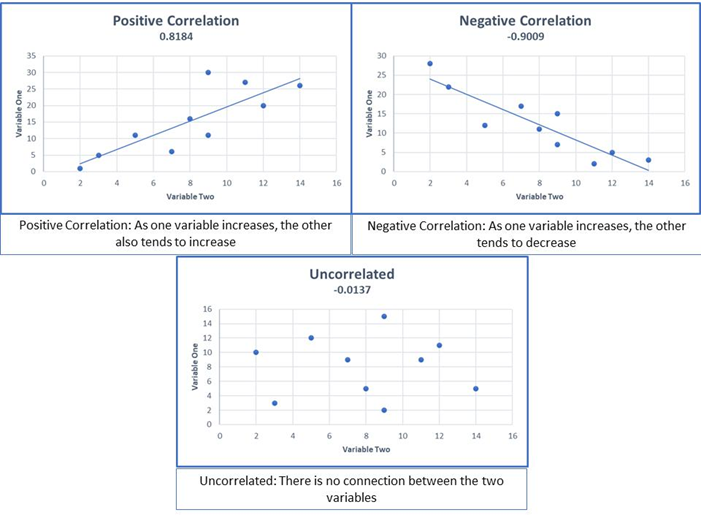
To understand regression to the mean, you must first understand correlation, which is the strength of the relationship between two variables. Variables that are positively correlated move together in the same direction. For example, height and shoe size are positively correlated because taller people tend to have bigger feet than shorter people.
Variables that are negatively correlated move in the opposite direction. For example, altitude and temperature are negatively correlated. As you move higher above sea level, temperatures become increasingly lower.
Uncorrelated variables have no linear relationship, and one variable’s movement doesn’t inform us about the other variable’s action. For example, there is no correlation between the amount of time a person spends watching TV and the size of their television.
Just because something is correlated does not mean that it’s an absolute relationship. For example, a short person can have big feet, and sometimes it’s hotter at higher altitudes. Correlation generally refers to a tendency: if one variable moves, correlation describes the other variable’s tendency to move and in which direction.
Correlation is commonly expressed as a coefficient with values ranging between -1.0 and 1.0. A correlation of -1.0 shows a perfect negative correlation, while a correlation of 1.0 indicates a perfect positive correlation. A correlation of 0.0 shows no linear relationship between the movement of the two variables. They are best illustrated on a scatter plot:
And Now, Regression
Regression to the mean is a statistical phenomenon in which extreme events are followed by those closer to the average. It occurs whenever the correlation between two factors is less than one. You can think of regression to the mean and correlation as the flip sides of the same coin. The weaker the correlation, the greater the regression.
For example, height is based on genetics and other factors such as childhood nutrition and disease. Because of the complex combination of factors that determine height, the correlation between parents’ and children’s height is less than one. (This study in the British Medical Journal estimates it’s 0.5.) Because the correlation is less than one, regression to the mean occurs. This suggests that although tall parents usually have tall children, their children will likely be shorter than them and closer to average height.
Regression to the mean also explains why the “Sports Illustrated Cover Jinx” isn’t really a jinx. According to this urban legend, an athlete will begin to perform worse after they appear on the cover of Sports Illustrated. But athletes are typically featured on the cover during a period of extreme performance. Why their future performance begins to move toward the average is a matter of statistics.
Why Regression to The Mean Is Difficult to Apply
On its face, the idea that more moderate events typically follow extreme circumstances is not difficult to grasp. It’s like accepting the law of gravity truism that “What goes up must come down.” But until we fully understand regression to the mean, it’s human nature to look for reasons why something happened beyond simple math.
In the height example, we’ve established that regression to the mean explains why tall parents tend to have children shorter than they are. But the reverse is also true: tall children are likely to have parents shorter than they are. When I first heard this reverse example, it made my head hurt because I couldn’t explain why. It is easy to think of reasons why a child might be shorter than her tall parents. Maybe she was a picky eater growing up, or perhaps she was sickly. It is more difficult to ascribe causes for how tall children would have shorter parents. And that’s the point. Regression to the mean is a mathematical tendency that occurs whenever two variables aren’t perfectly correlated. So, although we try to ascribe reasons for these fluctuations, “the truth is that regression to the mean has an explanation but does not have a cause,” Economics Nobel laureate Daniel Kahneman says.
How Regression to The Mean Relates to Investing
Failing to apply regression to the mean in investing can lead you to read too much into good and bad outcomes that have no explanation other than math. For example, more money flows into high performing mutual funds, while more cash flows out of low performing funds. This is because investors assume that high performing funds will continue to perform well. This chart from John Hancock Investments illustrates that fund flows follow performance:
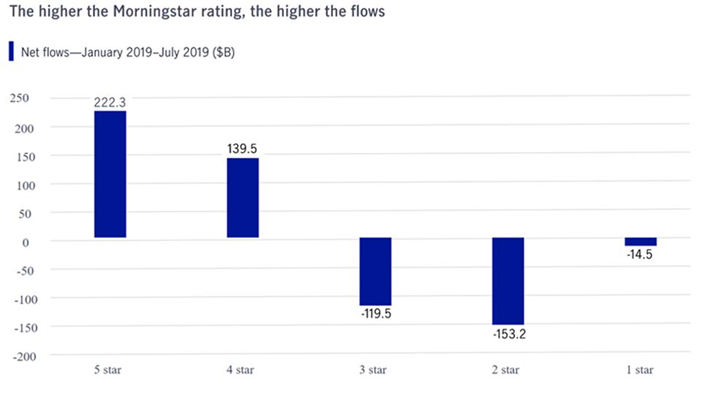
However, investors often would be better off doing the opposite as there’s a weak to negative correlation between how a fund has performed in the past and how it will perform in the future, according to research from the Yale School of Management. This is confirmed by a Wall Street Journal study which found that domestic equity funds ranked as five-star by research firm Morningstar were more likely to have one-star performance ratings three, five, and 10 years later. “A five-star rating was no more an omen of success than it was one of failure,” the researchers said. Similarly, academic research has found that investors who chose funds with poor recent performance earned higher returns than those who selected funds with superior recent performance.
The findings that low performing funds do better over time and high performing funds tend to under-perform are merely illustrations of regression to the mean. Luck and randomness play a significant role in investing, which means that perfect correlations are rare.
What Investors Should Do
So, does this mean you should invest more money in funds that are doing poorly and less in those with high returns? Sometimes. But what it really means is that whenever luck and chance are factors (which is pretty much everywhere in investing), you should expect regression to the mean to occur.
By making this phenomenon a mental model that you turn to first before looking for causes, you can avoid making decisions based on reasons that simply aren’t there. This can also help you have more patience with investments—both with managers and asset classes. Understand that low performers will likely do better in the future, and high performing asset classes and managers will probably do less well. And all this happens for no other reason than the mathematics of regression to the mean.
