Presidents and Markets: Investing Observations Based on Who Is in Charge
Alex Bates, CFA®, CAIA®Director of Investment Research
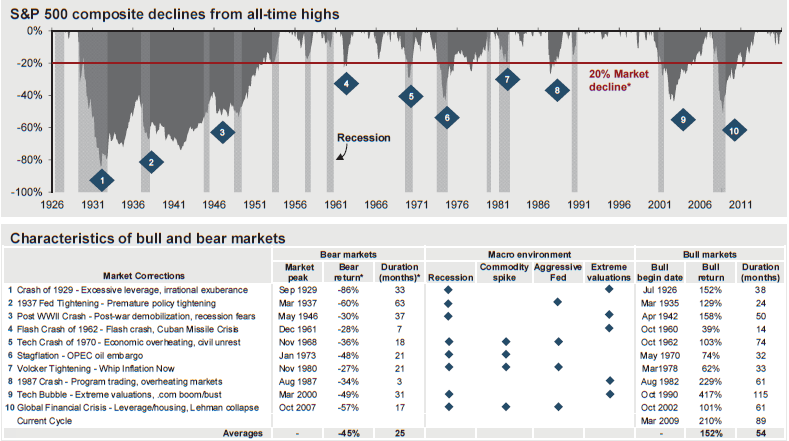
Usually during election years, I hear people talk about how the markets will move one way or another when gets elected. It’s a debate that tends to anchor itself in each person’s own political views and biases and doesn’t have any practical takeaways. I usually tell people who ask me “Will the market do better with President X or President Y in charge?” that it really doesn’t matter as much as you think it does. Markets are so globally connected now, and unless there are some drastic tax law changes or market structure reforms, markets will be influenced by the numerous macro and micro variables that have affected them regardless of President (or Congress). I’d argue that our Federal Reserve has more influence on global stock markets than any elected official. For instance, let’s look at the last 10 bear markets and their causes (courtesy of JP Morgan) – try to find anything strongly relating to legislative actions:
Source: FactSet, NBER, Robert Shiller, Standard & Poors, J.P. Morgan Asset Management. *A bear market is defined as a 20% or more decline from the previous market high. The bear return is the peak to trough return over the cycle. Periods of “Recession” are defined as using NBER business cycle dates. “Commodity spikes” are defined as significant rapid upward moves in oil prices. Periods of “Extreme valuations” are those where S&P 500 last 12 months’ P/E levels were approximately two standard deviations above long-run averages. “Aggressive Fed Tightening” is defined as Federal Reserve monetary tightening that was unexpected and/or significant in magnitude. Guide to the Markets – U.S. Data are as of June 30, 2016.
Disclaimer: All this will change should President Trump take office. My guess is that bear markets will be banned via executive order.
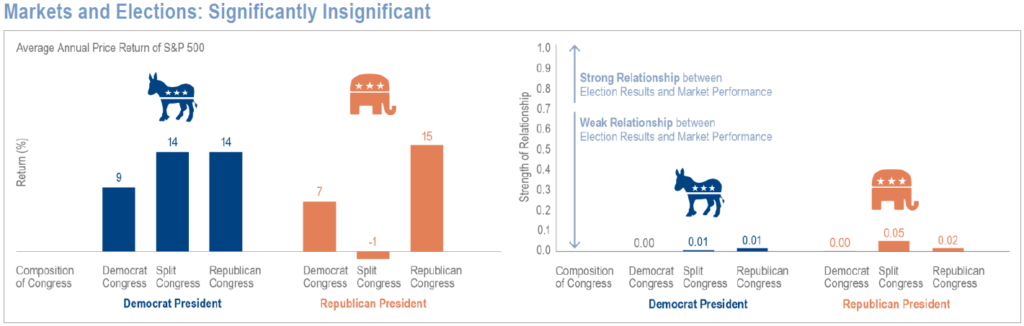
The following chart from Goldman Sachs shows returns of the S&P 500 Index by which political party is holding the Presidency and majority in Congress. The chart on the right determines the strength of relationship between election results and market performance. As you can see, the relationship is weak.
Left chart: Analysis from 12/31/1946 to 12/31/2015. The S&P 500 returns show average annual price returns for each Presidential party and corresponding Congressional party majority. Composition of Congress – Republican Congress refers to when both the House of Representatives and Senate have a Republican majority in both chambers; Democrat Congress refers to when both the House of Representatives and Senate have a Democrat majority in both chambers; Split Congress is when House of Representatives and Senate are not controlled by the same party. The S&P 500 returns show average annualized price returns for each major Presidential party and corresponding Congressional party majority. Right Chart: Analysis from 12/31/1946 to 12/31/2015. Strength of relationship is determined by R-Squared, a statistical measurement of how close a set of data fits a regression model (best-fitting line). Diversification does not protect an investor from market risk and does not ensure a profit. Past performance does not guarantee future results, which may vary.
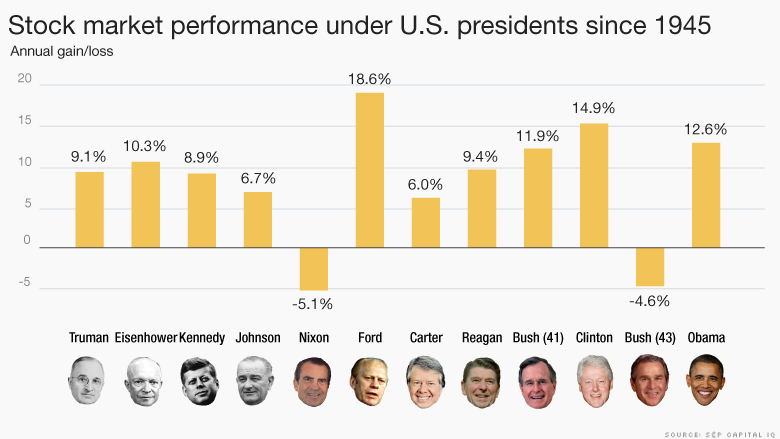
So, what’s the lesson? Invest based on your own personal and financial goals and not on who’s in charge. Bonus material: The following graphic from CNN Money shows the average annual gain for the S&P 500 Index during each presidency, as calculated by S&P Capital IQ:
Source: CNN Money, S&P Capital IQ
St. Louis Trust & Family Office is an independent, multi-family office and trust company that advises clients on more than $13 billion of investment assets and more than $15 billion of total wealth. Founded in 2002, St. Louis Trust & Family Office provides holistic, high-touch client service including customized, independent investment management and a full range of family office and fiduciary services. The firm serves a limited number of clients with substantial wealth in order to maintain very low client-to-employee ratios. Visit stlouistrust.com to explore how the firm manages complexity with unmatched expertise and focuses on Family, Always.
Get the latest St. Louis Trust & Family Office insights delivered right to your inbox.
We use cookies on our website to give you the most relevant experience by remembering your preferences and repeat visits. By clicking “Accept”, you consent to the use of ALL the cookies.
The St. Louis Family Office, Inc. and its wholly-owned subsidiary, The St. Louis Trust Company dba St. Louis Trust & Family Office (collectively “we”) use cookies to improve our services and your experience on our website by evaluating the use of our website and services, to provide social media features, to analyze our traffic, and to maintain the security and operation of the website. We also share information about your use of our website with our social media, analytics, and digital support service provider. By agreeing to the use of cookies on our website, you direct us to disclose your personal information to these service providers for those purposes. For more information, please see our Privacy Policy.
Necessary cookies are absolutely essential for the website to function properly. These cookies ensure basic functionalities and security features of the website, anonymously.
Cookie
Duration
Description
cookielawinfo-checkbox-analytics
11 months
This cookie is set by GDPR Cookie Consent plugin. The cookie is used to store the user consent for the cookies in the category "Analytics".
cookielawinfo-checkbox-functional
11 months
The cookie is set by GDPR cookie consent to record the user consent for the cookies in the category "Functional".
cookielawinfo-checkbox-necessary
11 months
This cookie is set by GDPR Cookie Consent plugin. The cookies is used to store the user consent for the cookies in the category "Necessary".
cookielawinfo-checkbox-others
11 months
This cookie is set by GDPR Cookie Consent plugin. The cookie is used to store the user consent for the cookies in the category "Other.
cookielawinfo-checkbox-performance
11 months
This cookie is set by GDPR Cookie Consent plugin. The cookie is used to store the user consent for the cookies in the category "Performance".
viewed_cookie_policy
11 months
The cookie is set by the GDPR Cookie Consent plugin and is used to store whether or not user has consented to the use of cookies. It does not store any personal data.
Functional cookies help to perform certain functionalities like sharing the content of the website on social media platforms, collect feedbacks, and other third-party features.
Performance cookies are used to understand and analyze the key performance indexes of the website which helps in delivering a better user experience for the visitors.
Analytical cookies are used to understand how visitors interact with the website. These cookies help provide information on metrics the number of visitors, bounce rate, traffic source, etc.
Advertisement cookies are used to provide visitors with relevant ads and marketing campaigns. These cookies track visitors across websites and collect information to provide customized ads.