

Why is it so hard to beat the market? A prime reason is that the skewed pattern of market returns stacks the odds against investors. Typically, a few high-performing stocks pull the average up, while the majority of stocks under-perform. Thus, buying and owning a few individual stocks will usually lead to poor performance.
Let’s Look at the Skew
The chart below is from Craig J. Lazzara at S&P and is an updated version of one in his fantastic white paper The Slings and Arrows of Passive Fortune. It shows the cumulative returns of the 1,012 stocks that constituted the S&P 500 over the 20 years ending in 2019.
Constituent Returns for the S&P 500 Are Highlight Skewed Individual Stock Returns 12/31/1999 – 12/31/2019
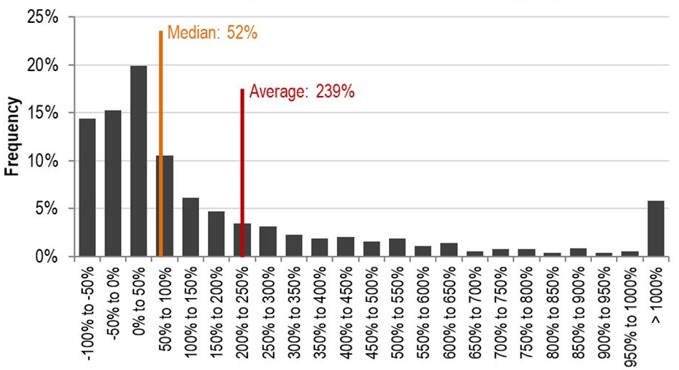
Over this period, the average (or mean) return of the S&P 500 was a cumulative 239%, equating to a 6.29% annualized return. The median cumulative return was 52%, which equates to 2.12% a year. That the average is higher than the median is important; while every stock has a 50/50 chance of being above the median, each has a much lower chance of being above average. Over this period, only 26% of stocks outperformed the 239% average.
This phenomenon is called a positively skewed distribution, in this case, of returns. The skew occurs because, while the most a stock can lose is 100%, potential positive returns are well above 100%.1 In a positively skewed distribution, the average is higher than the median.
Here are the top ten performing stocks and their cumulative returns over those 20 years:
- Apple, Inc., 9,092%
- UnitedHealthcare Group, 5,073%
- Humana Inc., 4,740%
- Sherwin-Williams Co., 3,800%
- Amazon.com, Inc, 3,785%
- AutoZone, Inc., 3,587%
- Aetna, Inc., 3,462%
- Ball Corporation, 3,077%
- TJX Companies, Inc., 2,901%
- Lockheed Martin Corp., 2,821%
This list is probably surprising to most investors since only two of the tech favorites, Apple and Amazon, are in the top 10. The rest are in other industries: healthcare, aerospace, specialty chemicals, apparel, automotive, and containers and packaging. The lesson here is that picking the high performers requires more than just spotting a hot industry or sector.
What About the FAANGM Stocks?
Facebook, Apple, Amazon, Netflix, Google and Microsoft (“FAANGM”) stocks have been major drivers of the market over the past decade or so. But not just because of their extraordinary returns.
As of August 26, 2020, the S&P 500 is up just over 9% YTD and the FAANGM stocks have contributed a 9.4% of that return, meaning that the other 494 stocks in the S&P 500 are aggregate net losers. But, the FAANGM stocks are not the only strong performers: 161 stocks are above the S&P 500’s average return and 234 are positive for the year. What makes the FAANGM special is that they have been major drivers of the market because (a) they are strong performers and (b) they have very large market capitalizations.
These are the top-performing stocks so far in 2020 (as of 8/27/20):
- NVIDIA Corp. up 115%
- DexCom Inc. 96%
- Pay Pal Holdings, Inc. 89%
- Amazon.com, Inc. 84%
- Advanced Micro Devices, Inc. 83%
- West Pharmaceutical Services 83%
- ABIOMED ABMD 82%
- Apple, Inc. 71%
- Service Now, Inc. 70%
- Salesforce.com 70%
As with the 20-year data, the list is not FAANGM-dominated; Amazon and Apple are in the top ten but the other FAANG’s rank lower with Netflix 16th at 63%, Microsoft 28th at 45%, Facebook 30th at 43%, and Google (Alphabet) 83rd with a return of 22%.
How can the FAANGMs account for over 100% of the S&P 500’s YTD return (i.e., they contributed 9.4% towards 9% aggregate return) when only two of them are top ten stocks? The answer is that they each have a substantial weighting in the S&P 500.
The top 5 stocks by weight in the S&P 500 are:
- Apple with 7.2% of the index
- Microsoft with 5.8%
- Amazon with 5%
- Alphabet (Google) with 3.5%
- Facebook with 2.3%
These five have a combined weight of about 24%. Add in Netflix at number 19, and their weight rises to 24.6%. So, nearly a quarter of the value of the S&P 500 is in the six FAANGMs! Strong performance and a big weight explain why these have been primary drivers of S&P 500 returns.
What the Skew Means for Investors
The skew is both bad and good news for investors.
The bad news is that the skewed distribution of returns stacks the odds against stock pickers. As noted above, for the 20 years ended 2019, 74% of stocks in the S&P 500 under-performed the average and year-to-date in 2020 (thru 8/26), 68% have under-performed. The safest way to avoid an under-performing portfolio is to own funds that include most or all of the stocks in the index, such as index funds.
The good news is that skilled stock pickers should be able to greatly outperform the index. Avoiding below-average stocks should lead to massive out-performance for an investment manager with the ability to pick high performing ones. Of course, this is difficult to do, but not impossible as some investment managers are adept at picking the relatively few high performing stocks. Behaviorally, however, it may be hard to stick with them or to stay invested in high performing stocks you own outright. This is because many high-flyers have periods of huge draw-downs. If you had owned some of the high-flyers of the past decade or two, you would have had incredible overall success, but there would have been challenging periods along the way, for instance:
- Facebook experienced draw-downs of 50%+, 40%+, and two more of 20%+.
- Amazon experienced a draw-down of 90%+ in the tech bubble, and after recovering had five more 25%+ declines.
- Netflix has experienced three separate draw-downs of over 70%, another over 50%, and four more of 25%+.
- Google experienced a draw-down of 65% during the financial crisis and had two more of 20%+.
What to Do About the Skew
Thanks to the skew, buying and holding a few stocks will likely lead to under-performance as the odds are against you in picking stocks that will outperform the average. The odds are also against you finding an investment manager who can outperform because investment managers also face the long odds of out-performing due to the skew.
So, what should an investor do? For most, it makes sense to just own broadly diversified funds such as index funds. For some, it may make sense to do both: have very diversified core holdings as well as own some funds with concentrated managers who have the skill to identify the high performing stocks in their areas of specialization. Just be aware of the odds of under-performing the market when straying from owning broadly diversified funds.
