

Executive Summary
The yield curve, and news about its inversion, has been a top story on television and the internet and in many financial publications during the past couple of weeks. Its popularity spiked on August 14th, after the S&P 500 dropped by 3% and some financial pundits blamed the yield curve inversion as the cause. But what does the yield curve have to do with the stock market? Should investors pay attention to it? And why does it matter if it inverts, whatever that means?
Below we hope to shed some light on the subject. First, we will define the yield curve, influences on its shape and what it means to become inverted. We will discuss the shape of the yield curve and its potential usefulness in forecasting an upcoming economic recession (it’s been successful the last seven times). Finally, we will provide some practical investment advice for those who feel inclined to act.
What Is an Inverted Yield Curve?
Actually, the first question should be: what is a yield curve? A yield curve is a plot of interest rates as a function of maturity dates. Picture a graph, showing interest rates on the y-axis and bond maturity dates on the x-axis. If you plot multiple bonds by the same issuer on the graph in accordance with their maturity dates and corresponding interest rates, the resulting line that connects the dots depicts the yield curve for that issuer. If this definition does not clear things up, which it may not, please be patient and finish this section where we use a real-life example to demonstrate a typical yield curve and an inverted curve.
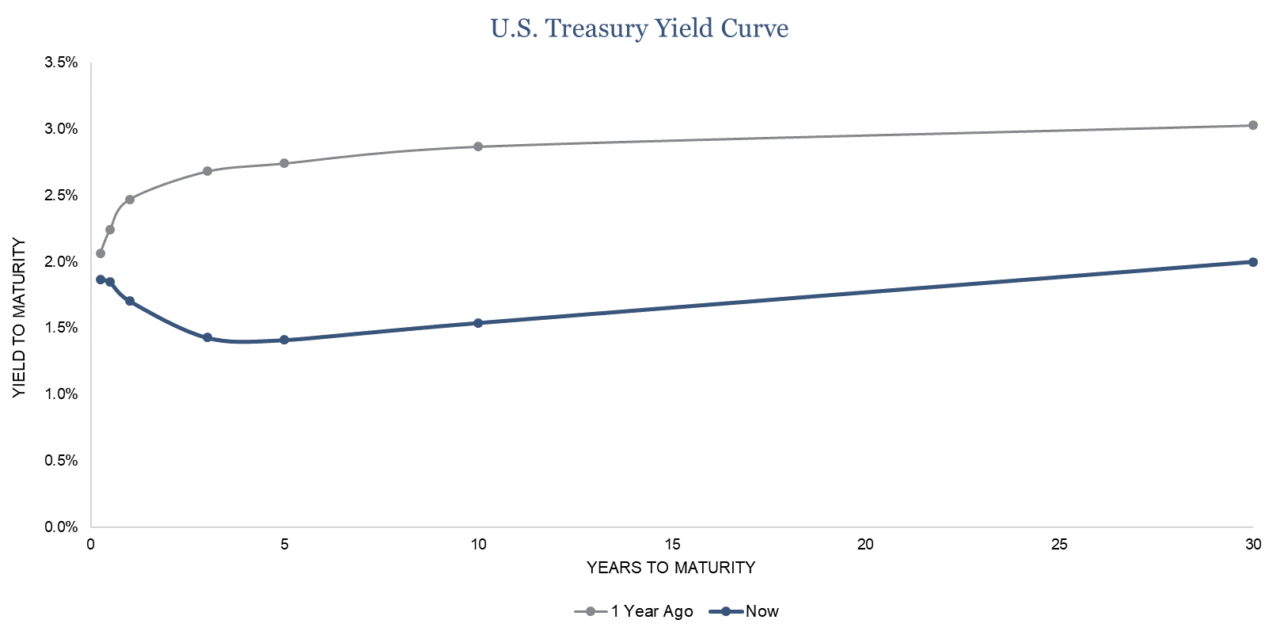
The recent headlines have focused on the yield curve for the U.S. Treasury market. The grey line in the chart below represents the typical yield curve investors associate with the U.S. Treasury market (it is the yield curve from one year ago). It slopes upwards to the right. Per the chart, investors earned an annualized yield of 2.0% when purchasing a 3-month T-bill, 2.6% when purchasing a Treasury bond maturing in two years, and 2.9% for a 10-year Treasury bond.
Now, let’s focus on the dark blue line. This is the current yield curve as of August 16, 2019. You will notice the 3-month T-bills earn more than a Treasury bond maturing in 10 years. The yield curve is no longer upward sloping. Instead it slopes downward until you get out to a maturity term of 5 years. This is what is referred to as an inverted yield curve.
Why Does the Yield Curve Typically Slope up to the Right?
Simply stated, uncertainty about the future leads the yield curve to slope up and to the right. Most investors equate uncertainty with risk and the higher the perceived risk, the higher the level of compensation (measured via interest rates) required to take on that risk. Hence, the curve slopes up towards higher interest rates as the maturity date extends further to the right.
The financial world primarily analyzes the question through the lens of credit risk, inflation and term premium. Credit risk measures the likelihood of an issuer paying back the money due to a lender. Imagine a friend (the issuer) asking to borrow money from you (the lender) and saying he will pay you back in three months. Now think of the same friend asking to borrow money from you and agreeing to pay you back in ten years. Is it more likely you will get the money back in the first scenario or the second? Ten years is a long time – a lot can happen between now and then to his financial situation – so most people would say it’s riskier to get paid back in ten years. Given the higher level of risk, you’d probably expect your friend to pay you more for that loan through a higher interest rate. In financial terms: the credit quality of the underlying issuer can change much more dramatically over the next ten years, so the lender would want to be compensated for this excess credit risk in the form of a higher interest rate. This is one reason why a yield curve slopes up and to the right.
In addition to credit risk, a lender must gauge the expected inflation over the life of the loan. Is the value of a dollar more likely to be the same in three months or ten years? In more relatable terms, is the cost of a gallon of milk more likely to be the same in three months or ten years? Most would predict the cost of milk will increase in next ten years; therefore, one should pay more in interest for a long-term loan because the original loan amount will not be as valuable ten years from now (it will buy less gallons of milk). Lenders expect to be compensated for the expected inflation risk over longer time periods.
Lastly, term premium plays an important role in the shape of a yield curve. Term premium is the excess yield that investors require to commit to holding a long-term bond instead of a series of shorter-term bonds. For example, suppose that the interest rate on the 10-year U.S. Treasury note is 5%, and that the interest rate on the 1-year U.S. Treasury bill is expected to average 3% over the next 10 years. The term premium on the 10-year U.S. Treasury note would be 2%. Seems rather straightforward; however, do not focus on the numbers in the example above because what matters most are the words “expected to average.” The key component of the term premium that influences the yield curve is investor expectations about the future course of short-term interest rates over the lifetime of the long-term bond. In the example above, the term premium on the 10-year Treasury note depends significantly on financial market expectations about the course of shorter-term U.S. interest rates over the next ten years. If investors feel uncertain about future economic conditions and the possible interest rates, they may be willing to lock in a longer-term bond at lower rate.
What Has Led to the Current Yield Curve Inversion?
People usually think of the term premium as being positive – that financial market participants require extra yield to induce them to hold a bond for a longer period of time – hence the yield curve sloping up and to the right. Yet there is nothing in the definition of the term premium that requires it to be so. For example, if bond investors are interested in locking in fixed rates of return for long periods of time, they may be willing to accept a lower yield on long-term securities (a negative term premium) in order to avoid the risks associated with rolling over their investments in a series of shorter-term bonds with uncertain, fluctuating interest rates.
Today, investors are doing just that – they are concerned and uncertain about the direction of the economy in the not-so-distant future so they’re willing to take a lesser return when purchasing a long-term security, as compared to the rate of return they require on a short-term security. This creates an inverted yield curve. Said another way, investors are confident that the economy is in good shape for the next few months, maybe even the next year, but after that, they are unsure. As they look out in the future, they fear a recession, which would pressure short-term interest rates downward. This fear drives investors to lock in lower long-term rates now, because these rates are higher than they expect them to be a few years from now, resulting in negative term premiums.
This is a high-level view of what’s happened to the yield curve. In reality, it’s much more complex. There are many factors influencing the shape of the yield curve. No one knows exactly why it has inverted now but financial “experts” reason it is likely a combination of investors forecasting lower future inflation, the potential for the Federal Reserve to ease short term rates and a reduction in the term premium. In addition, there is $15 trillion of global debt that is trading at a negative yield – meaning some investors are purchasing various global debt instruments knowing they will receive less capital in the future than they invested today. This has never happened before and has led to increased investor fear and anxiety, which heavily influences U.S. interest rates.
Is There a Relationship Between the Shape of the Yield Curve and the Markets?
As demonstrated by the inverted yield curve, the bond markets believe economic troubles are on the horizon. The stock market, while more volatile than it has been during most of its current ten plus year bull market run, is still trending toward a positive year. Why aren’t they in sync? The smart-aleck answer is that the bond markets are wiser than the equity markets. That’s a vast generalization, but most in the investment community would agree that the bond market is the more rational market and the stock market is more emotional (hence the frequent, extreme volatility). Think of the bond market as an adult and the stock market as a hormonal teenager. Do we know if the bond market is right and there will be a recession in the next year or two? No, we do not. But many extensive studies have proven there is a direct relationship between the shape of the yield curve and future economic performance. More exactly, research experts say an inverted yield curve is a reliable indicator of reduced economic growth or a recession on the horizon.
These experts strongly believe a recession is coming. The following table lists the time periods when the 3-month Treasury bill (on a bond-equivalent basis) is inverted with the 10-year Treasury bond (January 1968 – August 2019).
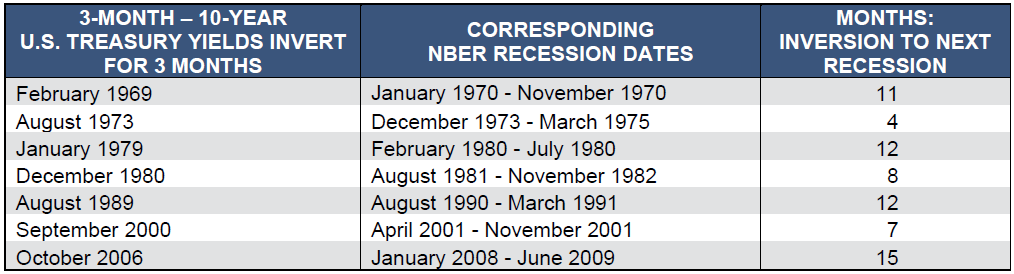
The table confirms the economists’ beliefs that an inverted yield curve leads to a future economic recession. What remains uncertain; however, is how long after the curve inverts does a recession begin? The data provides no clear answer. It could be four months later (1973) or 15 months later (2006) or never.
How Does the Inverted Yield Curve Effect Stock Market Performance?
In the past seven instances when a recession followed an inverted yield curve, the stock market dropped below its level when the inversion occurred. The S&P 500 Index is at approximately 2,900 today. If a recession happens in the near future, past history says the price of the S&P 500 Index will go below 2,900. Yet how high will the market rise before a possible future recession? And if investors exit the stock market today, how much upside will they miss? There are no clear-cut answers to these questions. As much as everyone craves for certainty – there is none in this instance. No one knows what will happen.
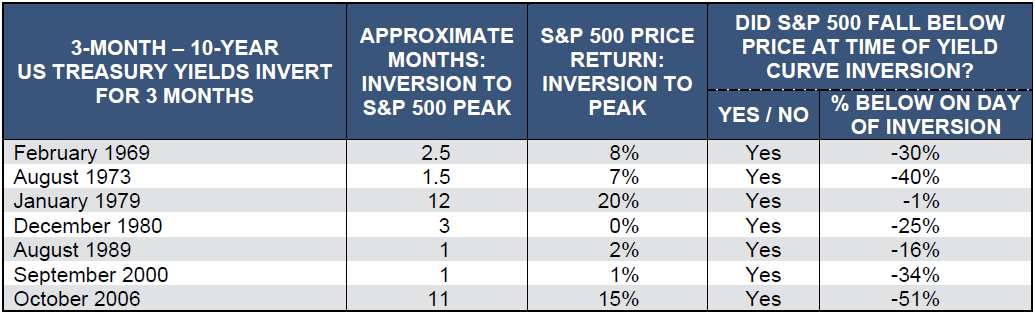
The chart below provides historical stock market performance data from the past recessions. In summary, once the yield curve inverted, the S&P 500 peaked anywhere from one month later to twelve months later. During those months from inversion-to-peak, the S&P 500 returned anywhere from 0% to 20%. In all cases, the index price dropped below (and in most cases, well-below) the price on the date of inversion. Therefore, investors need to be ready for a potentially bumpy ride in the future.
What Should I Do as an Investor?
We have learned that an inversion of the yield curve for one day, one week or even one month does not mean a recession is lurking immediately around the corner (despite what the financial headlines may say). However, this inversion seems to have the staying power of past inversions that led to recessions. Given this possibility, we suggest the following for investors (which is very similar to advice provided in my colleague John Jennings’ article titled “Late Cycle Investing”):
Confirm you’re comfortable with the level of risk in your investment portfolio | You have influence over the amount of risk you take in your investment portfolio. Has the risk profile of your portfolio changed significantly during the extended bull market run? If so, rebalance. Or is the risk profile no longer in alignment with your long-term goals? If it’s not and you feel compelled to make a change to your investment portfolio, search for an investment manager who focuses on preserving capital during market downturns. These managers should acknowledge that they have a high likelihood to underperform if the market goes up. At the same time, be skeptical of any manager who says they will fully participate in up markets and preserve capital in down markets.
Review your budget and liquidity needs | If you live off your investment portfolio, ensure you have enough cash and high-quality fixed income that will preserve value and be a resource for spending during a market pullback. This capital can also be utilized to rebalance back into risk assets should a recession materialize.
At the end of the day, doing nothing is perfectly acceptable and often the best choice for those with long time horizons. Though if you choose to sell securities from your investment portfolio, be wary of your next challenge – when to buy back into the market. It took two and a half years for the equity market to bottom after the last inversion in November 2006. How do you know when to reinvest the sale proceeds? What if you buy in only to see the market fall another 20%? Will you sell again (potentially at the very bottom) and miss the subsequent rebound? There are investors still sitting on cash from the financial crisis in 2008. They have permanently damaged their family’s wealth for the long term by trying to time the market. Tread carefully.
1Predicting U.S. Recessions: Financial Variables as Leading Indicators https://www.nber.org/papers/w5379, December 1995. Retrieved 2019-7-8. The Yield Curve as a Leading Indicator: Some Practical Issues https://www.newyorkfed.org/research/current_issues/ci12-5.html, July 2006. Retrieved 2019-7-8. It’s Official: The Yield Curve is Triggered. Does a Recession Loom on the Horizon? https://today.duke.edu/2019/07/its-official-yield-curve-triggered-does-recession-loom-horizon, July 1, 2019. Retrieved 2019-7-8.
